Is Biochar Production Profitable? The Real Revenue Math
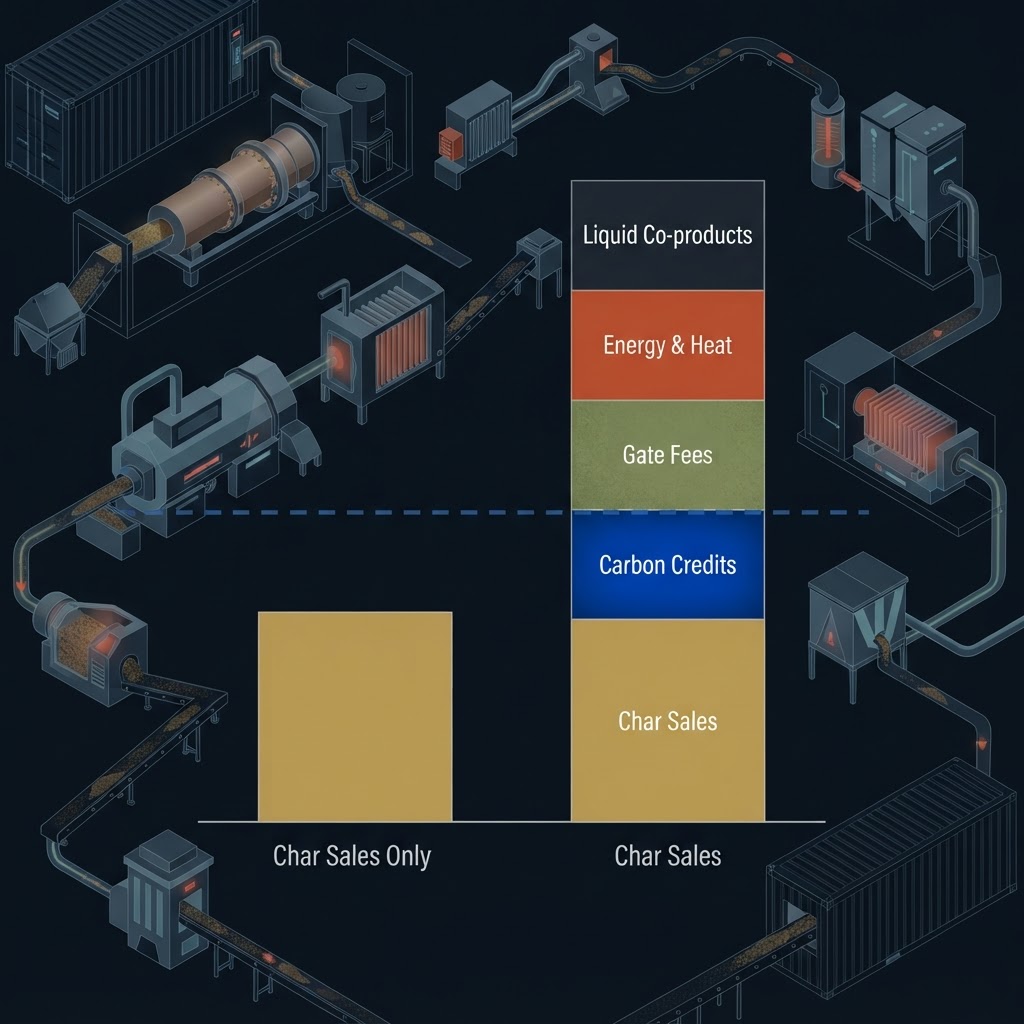
Biochar production is profitable, but almost never on biochar sales. That is the finding of the only peer-reviewed study on the first page of this search that carries a signed number, and it is the number every business plan should start from.
A 2026 cost-benefit analysis in the journal Biomass modelled a 20 year biochar operation at an abandoned rural estate in Tuscany, using primary field data rather than vendor brochures. In the scenario where the project earns money only by selling biochar and its liquid by-product, the net present value is negative at every discount rate tested: minus 165,991 EUR at a 3% discount rate for the three-machine case, with an internal rate of return of minus 17%. Adding voluntary carbon credit revenue to the same plant, same costs, same char price, flips it to plus 552,516 EUR with a 28% IRR.
Nothing about the machine changed. Only the revenue stack did. So the useful question is not whether biochar is profitable. It is which lines have to be in your model before it clears.
What biochar actually sells for in 2026
Start with the number people quote and the number people bank, because they are not the same.
The list prices are healthy. Bulk agricultural biochar runs 400 to 700 USD per metric ton, premium horticultural grades 800 to 1,500, and activated or specialty char 1,500 to 3,000. Sold by channel rather than grade, the spread looks similar: soil amendment buyers pay 200 to 600 USD per ton, stormwater filtration 300 to 800, and bulk carbon sequestration buyers only 100 to 250, which is the lowest margin and the easiest volume to win.
Now the realised number. The International Biochar Initiative surveyed 930 stakeholders across 96 countries for its 2025 market report and found that implied revenue per tonne across all commercial producers was 543 USD in 2025, up from 261 USD in 2023. That figure is rising fast, which is genuinely good news, and it also sits below most of the sticker prices above because it blends premium sales with commodity offtake, discounts, freight and unsold inventory.
Model the realised number, not the list. The gap between the two is where most first drafts of a biochar business plan die.
The five revenue lines, and which ones are bankable
A profitable char operation almost always earns on more than one line at once. Here is each one with a price and a verdict.
Char sales. Real, and the primary revenue source for most producers, but demand-constrained. In the same IBI survey, 39% of respondents named insufficient demand for physical biochar as a top barrier and 46% named low awareness of the product. Global production tripled from 180,150 tonnes in 2023 to 520,810 tonnes in 2025. Supply is scaling faster than offtake, and price follows that.
Carbon removal credits. The line that flips the sign. Biochar carbon removal credits trade at 100 to 250 USD per tonne of CO2, and in 2024 the observed range was 113 to 310 USD with a weighted average of 165. The Tuscan model assumed 1.5 tonnes of CO2 sequestered per tonne of char applied and priced a credit at 150 EUR. Verdict: bankable enough to model, not stable enough to underwrite. More on that below.
Gate fees on the feedstock. The most underrated line on this list, because it is the only one that pays before the reactor is lit. When waste producers pay you to take their material, feedstock cost goes negative. Tipping fees for clean biomass typically run 15 to 50 USD per ton, which is worth 250,000 to 900,000 USD a year at a 50 tonne per day plant. Verdict: the most bankable line there is, because it is contracted, local and indifferent to commodity prices.
Energy and heat. Here a competitor's own numbers make the point better than ours would. SynCraft published an electricity cost stack for its CW1800-500 wood power plant showing the heat benefit at minus 6 cents per kWh against a charcoal benefit of minus 1 cent per kWh, on charcoal earnings of 200 EUR per tonne. Char is a real credit against the cost of power. It is one sixth the size of the heat credit.
Liquid co-products. Wood vinegar, wood distillate, bio-oil. In the Tuscan model wood vinegar was priced at 180 EUR per hectolitre, and it still was not enough to save Scenario 1. In a fast pyrolysis plant the picture inverts: bio-oil becomes 50 to 65% of total revenue at 8 to 16 USD per MMBtu, and biochar becomes the side line. Verdict: it depends entirely on which reactor you buy, which is why you pick the reactor after you pick the revenue model.
What it costs to produce
Capital cost is where the scale question gets brutally non-linear. A complete installed pyrolysis plant runs 2 to 5 million USD at 5 to 10 tonnes per day, 8 to 18 million at 25 to 50 TPD, and 15 to 30 million at 50 to 75 TPD. Against that, the Tuscan case bought three to five mobile pyrolysis units for 150,000 to 200,000 EUR total. Both are real businesses. They are not the same business, and the small one still lost money on char sales alone, which should end the idea that going small is a way to dodge the economics.
Operating cost is more predictable and rarely quoted honestly. All-in for a 50 TPD plant, covering labour, electricity, water, maintenance, insurance and overhead, is 1.2 to 2.5 million USD a year, or roughly 70 to 140 USD per input ton of biomass. Inside that: 6 to 10 full time staff at 400,000 to 800,000 USD, maintenance budgeted at 3 to 5% of capital cost annually, and 75 to 150 kW of continuous electrical load.
Then there is the yield problem that no spreadsheet forgives. The Tuscan study assumed a 22% char yield, meaning roughly four and a half tonnes of biomass collected, dried, transported and handled for every tonne of char sold. Every one of those tonnes carries cost. That is why the per-input-ton operating figure matters more than the per-output-ton revenue figure, and why a free or paid-for feedstock changes a project more than a better sale price does. If you are still choosing hardware, the trade-offs across biochar production equipment at every price tier come before any of this.
Why carbon credits fix the model, and why they should not carry it
The scenario ladder in the Tuscan analysis is the clearest published evidence that credits are decisive. Char and wood vinegar alone: negative NPV throughout. Add voluntary carbon credits: positive at 3, 6 and 10% discount rates. Model the credits inside the EU Emissions Trading System from year five and the five-machine case reaches 901,692 EUR at 3% and stays positive even at a punishing 14% discount rate, with a 35% IRR.
This is no longer an exotic strategy. The share of producers reporting no carbon credit revenue fell from 58% in the 2023 IBI survey to 35% in 2025. Earning on credits is now the majority position in the industry.
Three cautions, stated plainly. First, the ETS scenario depends on a regulatory change that has not happened. It models what would occur if biochar removals became eligible for a compliance market, which is under discussion, not law. Second, even the vendor whose cost data appears above tells its own clients to factor credits in and not let them carry the project, because pricing is volatile and verification takes time. Third, credit revenue is not automatic revenue: it requires certification, monitoring and traceability, which is a separate discipline from running a reactor. The going rate is a moving target, and the current benchmarks for what a biochar carbon credit actually fetches per tonne are worth checking before you put a figure in a model.
Run your model once with the credit line set to zero. If it still works, you have a business. If it does not, you have a carbon project, and you should plan it as one.
The variable that moves the model more than char price
Look again at why Scenario 1 failed. Not because char sold too cheap. It failed because production costs, anchored by an upfront capital outlay, outran what the char could ever return. The lever with the most leverage is therefore the capital line itself.
In our target markets, governments fund 56% to 70% of project CAPEX, with validated grant routes in Spain at 70% under Andalusian IER, Portugal at 60 to 72% under SICE, and Greece at 56%. A 60% capital grant is more powerful in a 20 year model than doubling the char price, for a reason that is purely arithmetic: it lands in year zero, undiscounted, against the single largest negative cash flow in the project. Char revenue arrives spread across two decades and gets discounted every year on the way. We break down the routes and the application sequence in our guide to how governments fund most of the CAPEX on waste-to-energy projects.
Most biochar profitability guides never mention this, because equipment vendors do not sell grant applications and academics model private capital. It is the single biggest omission on the current first page.
When biochar is a by-product, the question changes shape
Everything above assumes biochar is the product. There is another configuration: buy a machine to solve a waste and energy problem, and let the char fall out of it.
Zero-X's X-150 is a containerised fixed-bed downdraft gasification platform. It ran a 1,939 hour continuous campaign in Paris under the COMETHA project, processing 16,382 kg of digestate pellets and producing syngas at 33% hydrogen with 99.98% tar conversion. It is independently validated on high-ash sludge, municipal solid waste and digestate, the difficult feedstocks that shut down clean-wood systems. At the small end, our X-5 prototype runs at a hotel in Canggu, Bali, where the problem being solved is a waste haulage bill, not a char market.
Be honest about the trade: a gasifier yields less char per tonne of feedstock than a dedicated pyrolysis kiln, because the process is tuned for energy-dense gas rather than solid carbon. What you get in exchange is a machine earning on gate fees, power and heat before the char is weighed, which means the char line can be worth 543 USD a tonne or 200, and the project still stands. That is the whole argument, and it is why we treat the sludge case in biochar from sewage sludge as an economics question rather than a chemistry one, and why the sizing logic in small-scale waste-to-energy systems drives the char output rather than the other way around. If char is a by-product for you, the real question is whether the waste-to-energy plant underneath it is profitable.
Six questions that decide whether your project clears its costs
- What do you realise per tonne, not what does it list at? Model 543 USD, not 1,500, unless you have a signed premium offtake.
- Do you have that offtake? Insufficient demand was named a top barrier by 39% of the industry. A tonne produced is not a tonne sold.
- Does your feedstock pay you? Tipping fees at 15 to 50 USD a ton turn your largest input cost into a revenue line. Nothing else on this list moves as far.
- Is char your product or your by-product? If it is your product, you need the credit line. If it is a by-product, you need the host plant to work.
- Who funds the capital? A 56 to 70% grant beats any price improvement you can negotiate, because it hits year zero undiscounted.
- What does the model do with credits set to zero? That answer tells you what kind of risk you are actually taking.
The honest verdict: yes, biochar production is profitable, and the published evidence says it is profitable through stacking rather than through selling char. Build the stack first and the reactor second. For the broader view of the sector, see the wider market for biochar production.
FAQ
How long is the payback period on a biochar plant?
Equipment vendors quote three to five years when feedstock arrives at low or negative cost, an offtake is signed and the plant runs near capacity. The peer-reviewed model is stricter: on char and co-product sales alone the investment never breaks even across a 20 year horizon at any discount rate, and only the scenarios including carbon credit revenue reach break-even quickly and hold it.
Can a small biochar business be profitable?
Small does not rescue the economics by itself. The smallest configuration in the Tuscan study, three mobile pyrolysis units costing 150,000 EUR and processing 300 tonnes of residue a year, was the worst performer of all on char sales alone, and even with voluntary carbon credits added it turned negative again at a 14% discount rate. Small works when the feedstock is genuinely free waste and the certification route is real.
Is biochar in high demand?
Demand is growing but is not the binding constraint that supply growth assumes. Production nearly tripled in two years and survey respondents project 3.5 million tonnes by 2027, yet insufficient demand for physical biochar and low awareness of the product were the two most-cited barriers in the 2025 survey, ahead of limited access to capital at 35%.
What is the biggest hidden cost in biochar production?
Biomass handling. At a 22% char yield you collect, dry, transport and feed roughly four and a half tonnes of material for every tonne you sell, and the all-in operating cost is best measured per input ton, at 70 to 140 USD, rather than per tonne of product. Drying is the part most first models leave out entirely.
Does biochar quality change the profitability?
It changes which market you can sell into, which is most of the answer. The same reactor can produce commodity char for bulk sequestration buyers at the low end of the range or filtration and horticultural grade at several times that, and certification for carbon credits imposes its own specification. Feedstock and operating temperature decide this more than the brand of machine does.
Available for advisory work, board seats and media appearances.
Julien Uhlig advises boards and funds and briefs newsrooms across Europe and North America. Enquiries are read personally.
We use cookies to improve your experience on this site. By continuing, you agree to our Privacy Notice.