Waste to Hydrogen Efficiency: The Four Numbers Explained
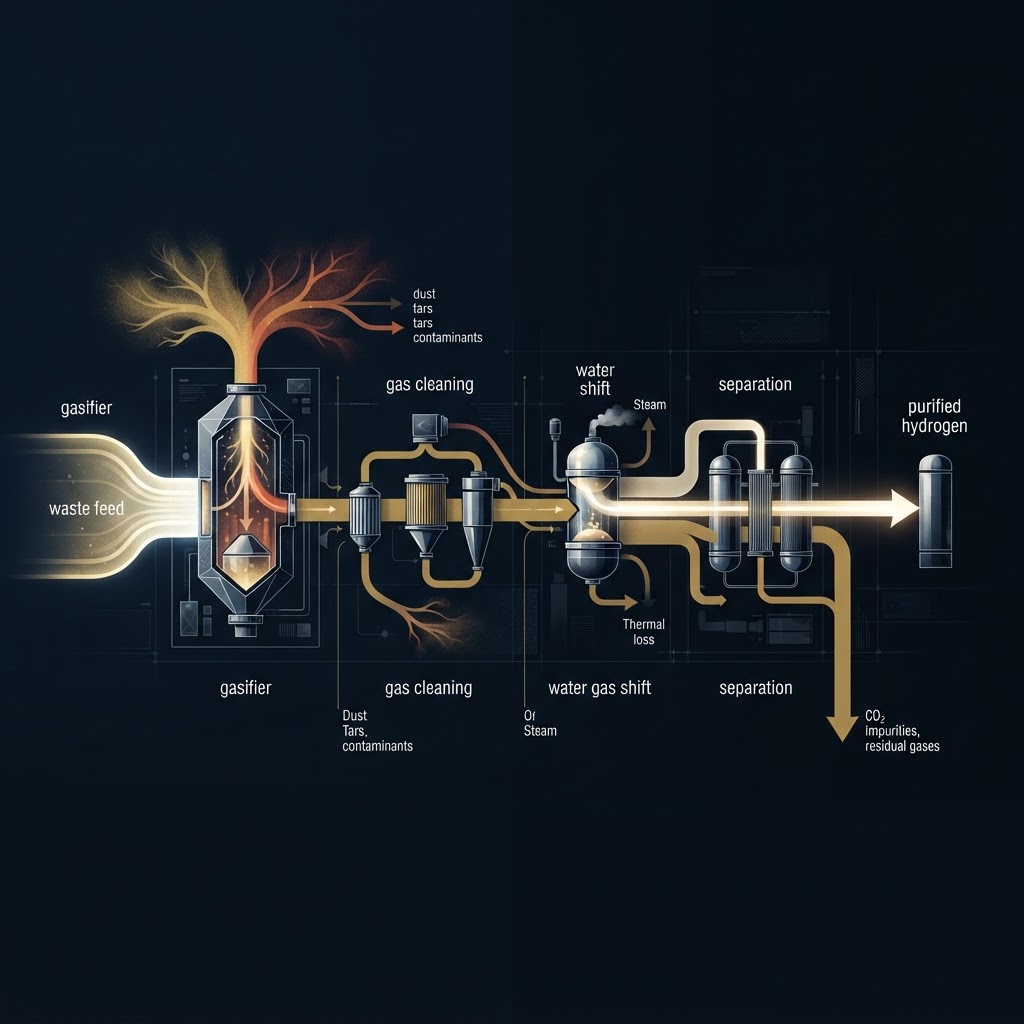
Ask three developers for their waste to hydrogen efficiency and you can get 92 percent, 70 percent and 43 percent, and all three can be honest. They are not measuring the same thing. One is quoting how much of the waste's chemical energy ends up in the raw gas. One is quoting a design projection for a commercial plant. One is quoting hydrogen out against waste in, after every loss in the chain.
This article separates the four numbers that travel under the word "efficiency", lays out the published ranges for each, and walks through where the energy actually leaves a waste to hydrogen chain. We build and run gasifiers, so we have a bias. Every figure below is from a published study or our own disclosed run, and we say which is which.
Four numbers that all get called waste to hydrogen efficiency
Cold gas efficiency
Cold gas efficiency (CGE) is the heating value of the syngas leaving the gasifier divided by the heating value of the feed going in. It is "cold" because it ignores the sensible heat of the hot gas and counts only chemical energy. It tells you how well the reactor works. It tells you nothing about hydrogen yet, because syngas is a mix of hydrogen, carbon monoxide, methane and carbon dioxide.
Carbon conversion efficiency
Carbon conversion is the share of the carbon in the feed that leaves as gas rather than as char, tar or ash. A low number means unconverted solids, which you pay for twice: once as lost gas and once as residue to dispose of. A 2024 open-access review of hydrogen from waste gasification reports a bubbling fluidised bed at 67.31 percent CGE and 63.70 percent carbon conversion at 900 C, and in the same paragraph swaps the textbook definitions of the two. If reviewers mix them up, a sales deck can too.
Waste to hydrogen energy efficiency
This is the number a buyer actually cares about: the heating value of the purified hydrogen divided by the heating value of the waste, usually on a lower heating value (LHV) basis. It includes every downstream loss: gas cleaning, the water gas shift, separation, and in the stricter versions the electricity and heat the plant imports. It is always lower than CGE. A widely cited critical review of waste to hydrogen technologies mixes thermal and process efficiencies in one table, which is part of why the numbers in circulation look so scattered.
Mass yield is not efficiency
Kilograms of hydrogen per tonne of waste is a yield, not an efficiency. It ignores the energy you put in to get it. A route that doubles the hydrogen per tonne by importing large amounts of electricity can look better on yield and worse on efficiency. Both numbers matter, and we treat yield on its own in our comparison of waste to hydrogen plants normalised to kilograms per tonne.
What the published efficiency numbers actually say
| Metric | Published value | Basis and scale | Source |
|---|---|---|---|
| Cold gas efficiency | 92% green waste, 73% sewage sludge, 62% olive pomace | Lab, 75 g samples | Ongen and Yesilova 2025 |
| Cold gas efficiency | 29.9% to 88.9% | MSW, circulating fluidised bed | Nandhini et al. 2022 |
| Carbon conversion | 40.1% to 79.9% | MSW, circulating fluidised bed | Nandhini et al. 2022 |
| Cold gas efficiency | 70.14% MSW, 57.19% RDF | Multi-stage downdraft, air blown | Abu Nabaa' et al. 2022 |
| Cold gas efficiency | slightly below 70% | RDF commercial reference design | Materazzi et al. 2019 |
| Biomass to hydrogen | 35% to 50% thermal, up to 52% steam | Literature range | Lui et al. 2020 |
| Biomass to hydrogen | 56% LHV entrained flow, 45% LHV fluidised bed | Modelled | Lui et al. 2020 |
| MSW plasma to hydrogen | 43.3% process | Modelled | Lui et al. 2020 |
| Steam methane reforming | 70% to 75% thermal | Fossil benchmark | Lui et al. 2020 |
| Energy conversion target | 62% to 74% | HYIELD, 3 MW demonstrator | CORDIS 2026 |
Three things stand out.
The best CGE figures come from the smallest samples. The lab study on green waste, olive pomace and sewage sludge reached 92 percent CGE on green waste using 75 gram samples, and the authors report that pure oxygen as the gasifying agent raised CGE. At plant scale, on mixed municipal waste, the MSW thermochemical conversion review shows a circulating fluidised bed spanning 29.9 to 88.9 percent CGE depending on temperature. Same metric, threefold spread.
Air blown gasifiers can have a decent CGE and still make poor hydrogen feed. A multi-stage downdraft gasifier on MSW reached 70.14 percent CGE, but the gas held only 10.89 percent hydrogen by volume, with nitrogen from the air diluting everything downstream. CGE alone hides that.
System efficiencies cluster well below SMR. Biomass routes sit at 35 to 56 percent against 70 to 75 percent for steam methane reforming. The HYIELD project, an EU-funded multi-stage steam gasification demonstrator at a Spanish cement plant, targets 62 to 74 percent energy conversion efficiency at 99.97 percent purity. That would close most of the gap. It is a target for a 4,000 hour campaign, not a result yet.
Where the energy goes, stage by stage
A waste to hydrogen chain has four stages: gasification, gas cleaning, the water gas shift, and separation. Each takes its cut.
1. The gasifier. Energy leaves as unconverted char, as tar, as heat in the hot gas and ash, and as the energy spent evaporating moisture in the feed. The gasifying agent matters as much as the reactor. Air brings nitrogen, which carries heat away and dilutes the gas. Oxygen or steam avoids the ballast but costs energy to produce. This stage is where CGE is measured.
2. Gas cleaning. Waste syngas carries tar, sulphur, chlorine and particulates that clean wood gas does not. Removing them costs energy. The RDF pilot plant and commercial design study projects a CGE slightly lower than 70 percent and names the extra electrical input for gas cleaning and ash vitrification as the main difference from biomass plants. Gas cleaning is also where many waste to hydrogen projects stall outright, and a plant that is offline has an efficiency of zero.
3. The water gas shift. Steam reacts with carbon monoxide to make more hydrogen and carbon dioxide. This is how a raw syngas with a third or less hydrogen becomes a gas worth purifying. The reaction releases heat, so some of the carbon monoxide's heating value leaves as heat rather than as hydrogen. Whether that heat is recovered is a design choice, and we cover the shift itself in our guide to turning syngas into hydrogen.
4. Separation and parasitics. Pressure swing adsorption needs compressed gas, and the tail gas it rejects still contains combustible components. Compressors, blowers, oxygen supply and the plant's own controls draw power. A plant that burns its tail gas for process heat recovers some of this. A plant that flares it does not.
The lesson from the KIT review of alternative thermal conversion of waste is that heat integration is where efficiency is won or lost: by using both the cold gas efficiency and the sensible heat of the syngas, an overall chemical recycling chain can reach up to 90 percent energy efficiency. That is a whole chain counting useful heat, not hydrogen alone, but it shows how much a hydrogen-only number leaves on the table.
Converting efficiency into kilograms per tonne
Buyers eventually translate efficiency into mass, because offtake contracts are in kilograms. The IEAGHG critical study on waste to low carbon hydrogen gives the cleanest pathway comparison we have found:
| Pathway | kg of MSW per kg of H2 | Implied kg of H2 per tonne of MSW |
|---|---|---|
| Gasification | about 23 | about 43 |
| Pyrolysis | about 25 | about 40 |
| Incineration plus electrolysis | about 80 | about 12.5 |
| Dark fermentation | about 143 | about 7 |
The right column is our arithmetic on their figures. Thermochemical routes use roughly three to six times less waste per kilogram than the alternatives, which is why IEAGHG ranks them the most balanced pathways. The same study still puts CCS-abated waste to hydrogen at 5.15 to 14.91 US dollars per kilogram, above fossil hydrogen, and names limited process efficiency as one of the cost drivers.
The literature range is much wider than one table suggests. Across feedstocks the 2024 gasification review finds 15 to 300 grams of hydrogen per kilogram of feed, so 15 to 300 kg per tonne. For mixed household waste specifically, the same review cites a bench result of about 32 grams per kilogram, and the wider spread of bench and model figures is set out in our article on municipal solid waste to hydrogen yields. A claim well outside that band needs a mass and energy balance before it needs a meeting.
What our own run tells you, and what it does not
Zero-X holds the global master license to the X-150, a containerised 150 kg/h fixed-bed downdraft gasification platform validated at the Paris COMETHA project, Fraunhofer IKTS and Hochschule Zittau/Goerlitz. In our 1,939 hour continuous COMETHA campaign, the X-150 processed 16,382 kg of digestate pellets in oxy-steam mode and produced syngas at 33 percent hydrogen, with an H2 to CO ratio of 1.95 to 1, 99.98 percent tar conversion and no nitrogen ballast.
Here is how to read that in efficiency terms, honestly:
- Oxy-steam with zero nitrogen removes the dilution that sinks air blown downdraft gas (10.89 percent hydrogen in the study above). Every downstream stage handles a smaller, richer gas stream.
- 99.98 percent tar conversion protects the shift catalyst and the adsorbers, which is what lets a chain keep its design efficiency over thousands of hours instead of hundreds.
- An H2 to CO ratio of 1.95 means much of the remaining carbon monoxide can still be shifted into extra hydrogen.
What the run does not give you is a waste to hydrogen system efficiency. Those are gasifier-side inputs. A system number depends on the shift, separation and heat integration package a partner builds around the unit, and on the feed. We would rather tell you that than quote a gasifier figure as if it were the whole chain.
Six questions to ask before you believe an efficiency claim
- Which efficiency is it? CGE, carbon conversion, or hydrogen out over waste in. If the answer is CGE, the hydrogen number is lower.
- LHV or HHV? The same plant reports a higher efficiency on HHV than on LHV. Compare like with like.
- Wet or dry basis? Efficiency on dry feed flatters any plant fed wet waste.
- Are imported electricity and oxygen counted? A high number that ignores the oxygen plant is a gasifier number.
- Is heat credited? Recovered heat sold to a neighbour can be legitimate, but it should be stated separately from hydrogen.
- Measured or modelled, and for how many hours? A 75 gram lab sample, a simulation and a multi-thousand hour campaign are three different levels of evidence.
FAQ
How efficient is hydrogen production from waste compared with natural gas?
Published biomass and waste gasification routes reach about 35 to 56 percent from feed to hydrogen, against 70 to 75 percent for steam methane reforming of natural gas. Waste wins on feedstock cost and carbon, not on thermal efficiency.
Is a 90 percent cold gas efficiency realistic for waste?
It has been measured, at 92 percent on green waste, but on 75 gram lab samples. On mixed municipal waste at fluidised bed scale, published CGE runs from about 30 to 89 percent. Ask for the scale and the feed behind any figure above 80 percent.
Which waste to hydrogen route uses the least waste per kilogram?
Gasification, at about 23 kg of municipal waste per kilogram of hydrogen in the IEAGHG comparison, with pyrolysis close behind at 25. Incineration with electrolysis needs about 80 kg and dark fermentation about 143 kg.
Does carbon capture lower waste to hydrogen efficiency?
For gasification, capture rides on a step the plant needs anyway: separating hydrogen leaves a concentrated carbon dioxide stream. In the RDF reference design close to 100 percent of the feed carbon is recovered as CO2, and the projected CGE still sits just under 70 percent.
We use cookies to improve your experience on this site. By continuing, you agree to our Privacy Notice.